Nano Spectrophotometers for DNA, RNA, and Protein Analysis
Nano spectrophotometers (microvolume UV-Vis spectrophotometers) quantify the concentration and purity of DNA, RNA, and protein samples from 1 to 2 microliters of sample placed directly on the measurement surface without cuvettes or dilution, measuring absorbance from 190 to 850 nm and calculating concentration, A260/A280 purity ratio, and A260/A230 purity ratio automatically. They are a standard instrument in any molecular biology laboratory performing PCR, RT-qPCR, sequencing library preparation, cloning, and protein expression, and are used daily to verify sample quality before downstream applications.
MBP provides purchase order procurement for nano spectrophotometers for research institutions across the USA and Canada. Request a quote for nano spectrophotometers for DNA, RNA, and protein quantification and purity analysis by contacting customerservice@mbpinc.net.
Nano Spectrophotometer
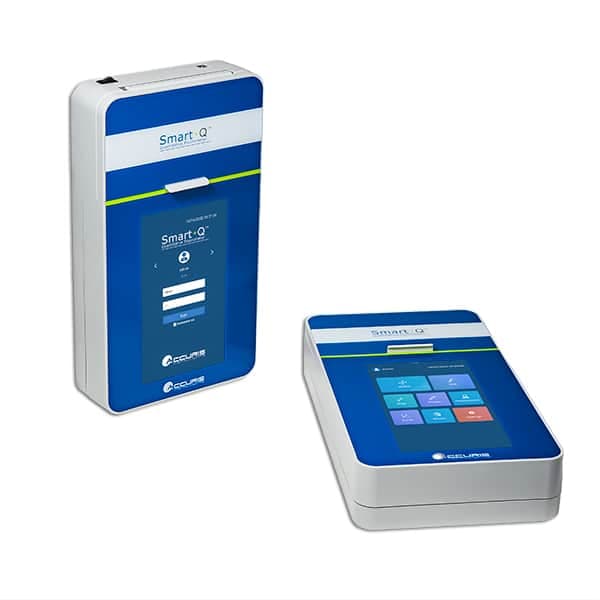
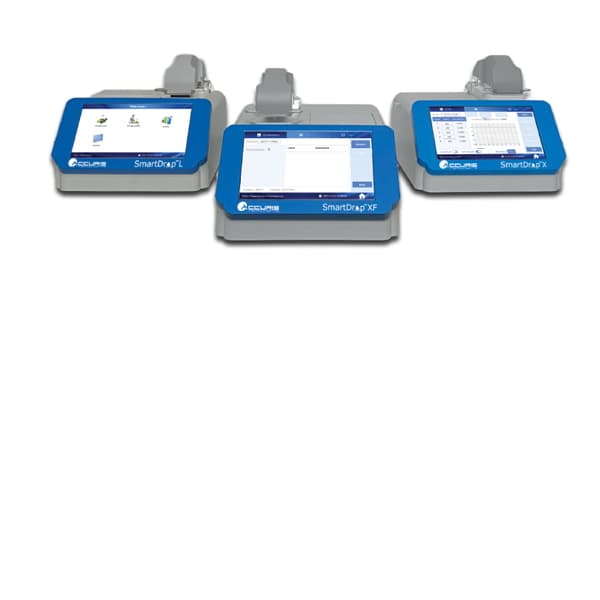
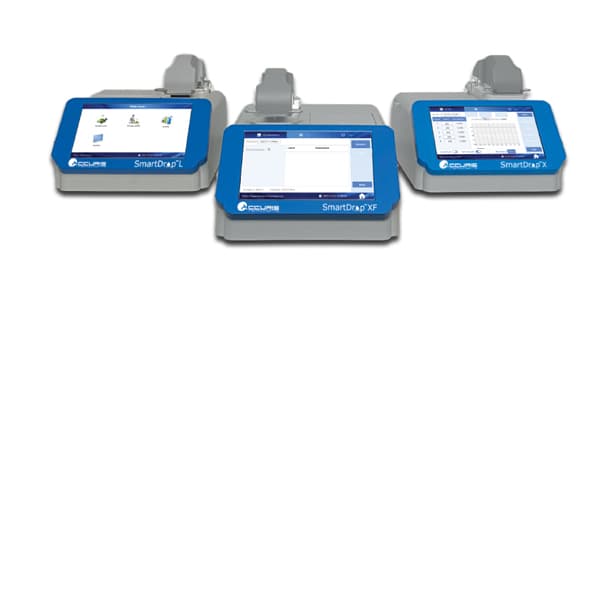
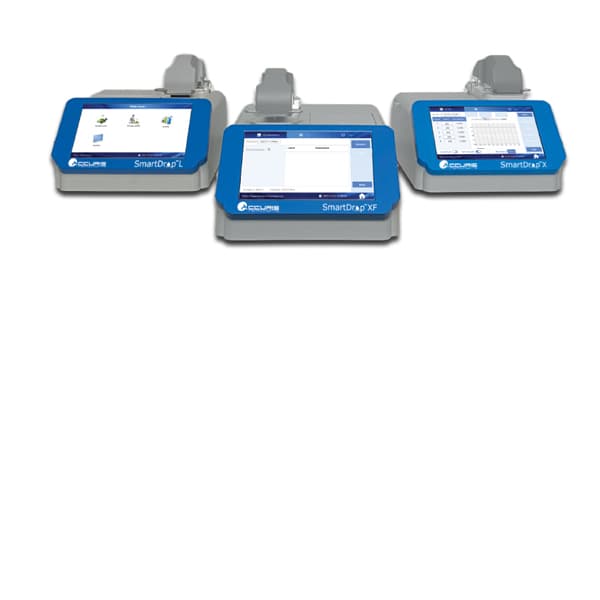
Showing 1 to 5 of 5 results
What Are Nano Spectrophotometers?
A nano spectrophotometer (microvolume UV-Vis spectrophotometer) measures the absorbance of ultraviolet and visible light through a small volume (1 to 2 microliters) of sample held by surface tension between two optical-quality fiber pedestals or on a measurement arm surface, without a cuvette. The Beer-Lambert law relates absorbance to concentration: at 260 nm, 1 absorbance unit (AU) corresponds to 50 micrograms/mL of double-stranded DNA (dsDNA), 40 micrograms/mL of RNA, and 33 micrograms/mL of single-stranded DNA (ssDNA). At 280 nm, protein absorption from aromatic amino acids (tyrosine, tryptophan, phenylalanine) allows concentration estimation using the A280 method or extinction coefficients. Purity ratios A260/A280 and A260/A230 indicate contamination: A260/A280 of 1.8 (DNA) or 2.0 (RNA) indicates high purity; ratios below these values indicate protein or other UV-absorbing contaminant carryover. A260/A230 above 2.0 indicates the absence of carryover from EDTA, guanidinium, or carbohydrate contaminants common from silica-column purification kits. The full spectrum from 190 to 850 nm allows additional analysis: OD600 for bacterial culture density; custom wavelength measurements; and detection of heme, chlorophyll, and other chromophores. A nano spectrophotometer is the fastest way to verify DNA or RNA concentration and purity before PCR, sequencing, or cloning; it uses 1 to 2 microliters, takes 5 to 10 seconds per read, and requires no cuvette or dilution for concentrations above approximately 2 ng/microliter.
What you will find:
- Nano spectrophotometers for rapid microvolume nucleic acid and protein quantification using pedestal and cuvette measurement modes.
- Fluorometer systems for highly sensitive DNA, RNA, and protein quantification using fluorescence-based assays.
- Nano Spectrophotometer Accessories for SmartDrop instruments, including replacement printer paper rolls, pedestal reconditioning solution, and standard-size cuvettes.
How to Choose a Nano Spectrophotometer
Single-sample vs. multi-sample throughput
Single-pedestal nano spectrophotometers (most models) measure one sample at a time, with read times of 5 to 10 seconds per sample. For labs measuring fewer than 20 samples per session, a single-sample model is adequate. High-throughput eight-pedestal models (such as the NanoDrop Eight) accept a row of 8 samples simultaneously from a 96-well plate strip, processing 96 samples in approximately 2 minutes, which is essential for next-generation sequencing library prep workflows, automated sample QC, and high-throughput screening.
Measurement range and sensitivity
The upper concentration limit of nano spectrophotometers is set by the path length: standard 1 mm path length accommodates dsDNA from 2 to 3,700 ng/microliter without dilution (NanoDrop-type instruments auto-select 0.2 mm or 1.0 mm path length based on absorbance). The lower detection limit is approximately 2 ng/microliter for dsDNA in UV mode; samples more dilute than this require fluorometric quantification (Qubit-type instruments with fluorescent dyes specific to DNA, RNA, or protein).
Contaminant detection algorithms
Basic nano spectrophotometers report A260, A280, A260/A280, A260/A230, and calculated concentration. Advanced models (NanoDrop Ultra type) include software algorithms (Acclaro-type intelligence) that use full-spectrum data to identify and correct for specific contaminants: dsDNA contamination in RNA samples; RNA contamination in dsDNA; guanidinium from RNA extraction kits; and EDTA carryover. Specify these advanced features for workflows where sample purity assessment matters for downstream application success (RT-qPCR, long-read sequencing, CRISPR libraries).
Touchscreen vs. PC-connected operation
Standalone touchscreen nano spectrophotometers allow operation without a connected PC, storing results internally or exporting via USB. PC-connected models require a laptop or PC with the instrument software installed for operation and data export, but provide more flexibility in data management, LIMS integration, and custom method programming. For shared lab equipment where multiple users access the instrument, touchscreen standalone models are operationally simpler.
Protein measurement modes
All nano spectrophotometers measure protein at A280 using a user-specified extinction coefficient. Advanced models add preprogrammed protein types (BSA, IgG, lysozyme, human serum albumin), A205 direct measurement for proteins with low or no A280 signal, and colorimetric assay support (BCA, Bradford, Lowry, Pierce 660 nm) for protein quantification using plate-reader-style microvolume cuvette adapters.
Specifications Context
Measurement accuracy at 260 nm is typically stated as plus or minus 1 to 2% coefficient of variation for repeat measurements of the same sample. Wavelength accuracy is specified as plus or minus 1 nm. Confirm the dynamic range covers the sample concentrations typically encountered in your workflow; highly concentrated DNA libraries from solid-phase extraction (above 500 ng/microliter) are accurately measured at 0.2 mm path; dilute RNA samples from small cell numbers or rare tissues may fall below the UV detection limit and require fluorometric quantification. Calibrate the blank (blanking solution) using the same buffer or elution solution as the sample; blanking with water when the sample is in TE buffer introduces a measurement error at A230 from EDTA absorption.
To discuss product availability or get selection guidance, contact the MBP team.
FAQ